Grains and bread
Cooked pasta
A typical 150 g (5.5 oz, about 1 cup) serving of cooked pasta has about 237 kcal and 2.7 g of fiber, from 158 kcal per 100 g.
Estimated satietyHow it is calculated
Estimated satiety: 2 out of 5
| Starting point | +1 |
|---|---|
| Low energy density | +1 |
Our own estimate from the values per 100 g: useful for comparing foods with each other, not a measurement in people. Holt index (1995): 119 (white bread = 100).
- Prepared by
- Alex Gonzalez
- Last updated
- Next review
- Sources
- 7 primary
- Data
- USDA FDC 169737
No clinical review. No advertising from drug companies and no affiliate links.How we work
Nutrition facts
- Calories
- 237 kcal per serving
- 158 kcal per 100 g (3.5 oz)
- Protein
- 8.7 g per serving
- 5.8 g per 100 g (3.5 oz)
- Carbohydrates
- 46.4 g per serving
- 30.9 g per 100 g (3.5 oz)
- of which sugars
- 0.8 g per serving
- 0.6 g per 100 g (3.5 oz)
- Fiber
- 2.7 g per serving
- 1.8 g per 100 g (3.5 oz)
- Fat
- 1.4 g per serving
- 0.9 g per 100 g (3.5 oz)
- of which saturated
- 0.3 g per serving
- 0.2 g per 100 g (3.5 oz)
- Water
- 93.2 g per serving
- 62.1 g per 100 g (3.5 oz)
Source: USDA FoodData Central: Pasta, cooked, enriched, without added salt (FDC ID 169737), accessed September 23, 2026.
A typical 150 g (5.5 oz, about 1 cup) serving provides about 237 kcal, 8.7 g of protein, and 2.7 g of fiber.
What it is and how to eat it
Dried pasta is made from durum wheat semolina and water and comes in many shapes, such as spaghetti, macaroni or noodles, called fideos, which in Argentina, Uruguay and other countries is the general word for pasta; in Mexico short curved macaroni are called coditos. It is bought dry and eaten cooked, and it absorbs water as it cooks, so 100 g of cooked pasta has far fewer calories than 100 g of dry pasta. This page covers cooked white pasta, unsalted and enriched (with added iron and B vitamins), according to USDA, with 158 kcal, 5.8 g of protein and 1.8 g of fiber per 100 g.
A 150 g (5.3 oz) serving of cooked pasta provides 237 kcal, 8.7 g of protein and 2.7 g of fiber, so it works better as a side to a protein, such as tuna, chicken, eggs or legumes, or to the turkey meatballs in tomato sauce, than as a meal on its own. It is low in fat and fiber and is usually well tolerated in the first few days of treatment, when the 2025 nutrition advisory on GLP-1 therapy suggests avoiding fatty and very high-fiber foods, and after a dose increase; in those days a tomato or vegetable sauce is a better choice than cream or lots of cheese. If you eat little, start with the protein, as the same advisory suggests, and serve half a portion of pasta.
What the evidence says
In the Holt satiety index (1995), white pasta scored 119, a little more than the white bread reference (100) and less than whole-wheat pasta (188). Its glycemic index is low, an average of 49 for boiled white spaghetti in the 2008 international tables, almost the same as whole-wheat pasta (48). Cooking pasta al dente is often said to raise blood glucose less, but in a crossover trial with 12 healthy adults who ate pasta cooked for 11, 16.5 or 22 minutes there were no significant differences in glucose or insulin between the three cooking times (American Journal of Clinical Nutrition, 1990), and in another with 13 people with diabetes, spaghetti cooked for 5 or 15 minutes had a glycemic index of 45 and 46 (Diabetes Care, 1986). With 1.8 g of fiber per 100 g, 1.1 g per 100 kcal, it falls short of the EU minimums for a "source of fibre" claim, 3 g per 100 g or 1.5 g per 100 kcal (Regulation (EC) No 1924/2006).
Recipes with this food
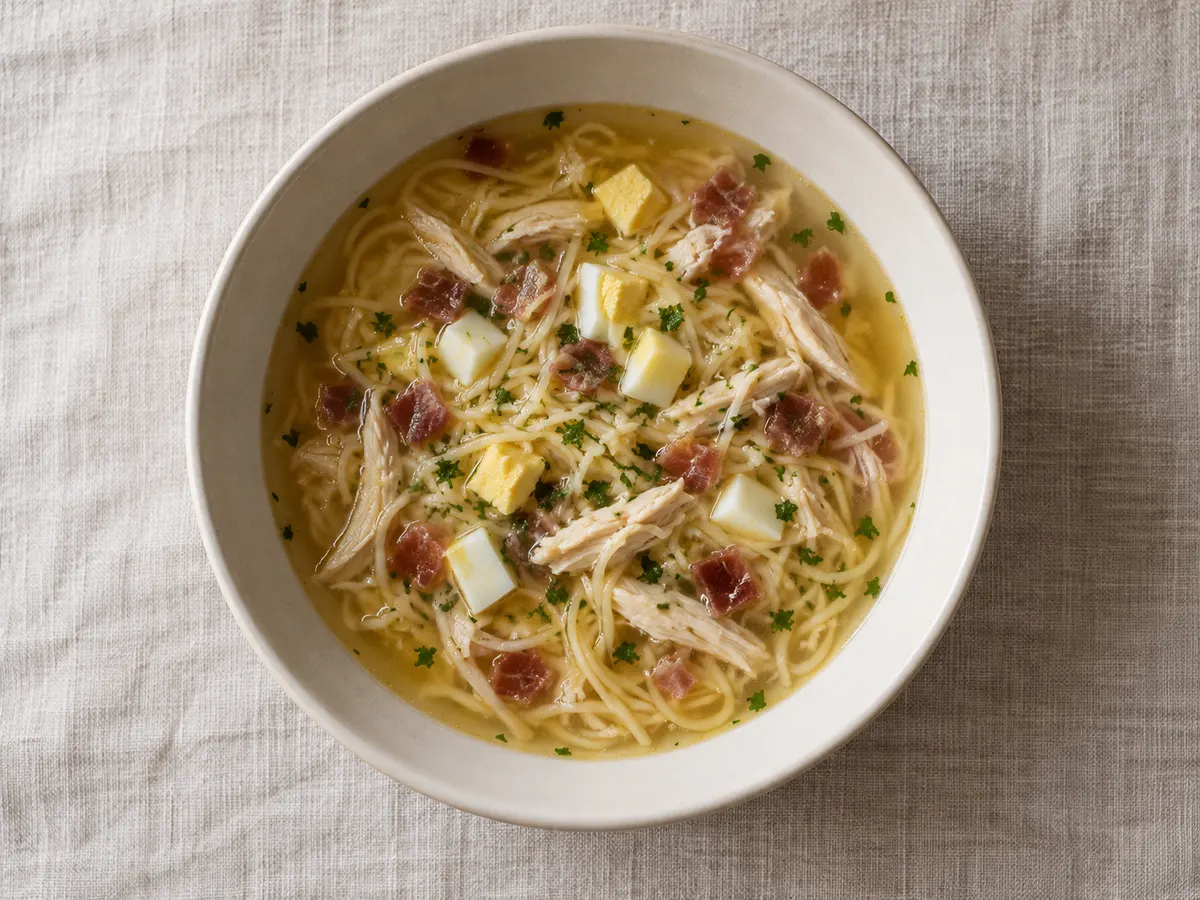 Light Spanish picadillo soup with chicken, egg, and ham18.4 g protein per serving
Satiety
The 1 to 5 score is our own estimate: it starts at 1 point, adds points for low energy density, for protein and fiber per 100 kcal, and for the water in solid foods, and subtracts points for drinks with calories. It is useful for comparing foods with each other; it is not a measurement in people.
This food was measured in people: in the satiety index by Holt and colleagues (1995), which compared 240 kcal servings of 38 foods over two hours, it scored 119 versus 100 for white bread. In other words, it was more filling than the same calories of white bread. Source: Holt SH, Miller JC, Petocz P, Farmakalidis E. A satiety index of common foods. Eur J Clin Nutr. 1995;49(9):675-90.
Frequently asked questions about cooked pasta
How much protein is in a 150 g (5.5 oz) serving of cooked pasta?
100 g (3.5 oz) of cooked pasta has 5.8 g of protein. A typical 150 g (5.5 oz) serving has about 8.7 g of protein. That is 3.7 g of protein per 100 kcal.
How many calories does a 150 g (5.5 oz) serving of cooked pasta have?
100 g (3.5 oz) of cooked pasta has 158 kcal. A typical 150 g (5.5 oz) serving has about 237 kcal. That is a low energy density.
Does cooked pasta have fiber?
100 g (3.5 oz) of cooked pasta has 1.8 g of fiber. A typical 150 g (5.5 oz) serving has about 2.7 g of fiber.
Is cooked pasta filling?
Not very filling for the calories it provides: our estimated satiety score is 2 out of 5. It is based on: low energy density. It was also measured in people: in the Holt satiety index (1995), with 240 kcal servings, it scored 119 versus 100 for white bread.
What counts as a normal serving of cooked pasta?
We use 150 g (5.5 oz) as a typical serving, about 1 cup. That amount provides about 237 kcal, 8.7 g of protein, and 2.7 g of fiber. It is a reference for calculations, not a recommendation of how much to eat.
Compare with…
Similar foods
Sources
Sources for the data on this page, with the access date.
- Official databaseU.S. Department of Agriculture, Agricultural Research Service.USDA FoodData Central: Pasta, cooked, enriched, without added salt (FDC ID 169737).accessed .
- Clinical trialEuropean Journal of Clinical Nutrition.Holt SH, Miller JC, Petocz P, Farmakalidis E. A satiety index of common foods. Eur J Clin Nutr. 1995;49(9):675-90.accessed .
- Clinical guidelineObesity (Wiley).Mozaffarian D, et al. Nutritional priorities to support GLP-1 therapy for obesity: A joint Advisory from the American College of Lifestyle Medicine, the American Society for Nutrition, the Obesity Medicine Association, and The Obesity Society. Obesity. 2025;33(8):1475-1503. doi:10.1002/oby.24336.accessed .
- Official databaseDiabetes Care (American Diabetes Association).Atkinson FS, Foster-Powell K, Brand-Miller JC. International tables of glycemic index and glycemic load values: 2008. Diabetes Care. 2008;31(12):2281-2283. doi:10.2337/dc08-1239.accessed .
- Clinical trialAmerican Journal of Clinical Nutrition.Bornet FR, Cloarec D, Barry JL, et al. Pasta cooking time: influence on starch digestion and plasma glucose and insulin responses in healthy subjects. Am J Clin Nutr. 1990;51(3):421-427. doi:10.1093/ajcn/51.3.421.accessed .
- Clinical trialDiabetes Care (American Diabetes Association).Wolever TM, Jenkins DJ, Kalmusky J, et al. Glycemic response to pasta: effect of surface area, degree of cooking, and protein enrichment. Diabetes Care. 1986;9(4):401-404. doi:10.2337/diacare.9.4.401.accessed .
- RegulatorOfficial Journal of the European Union (EUR-Lex).Regulation (EC) No 1924/2006 on nutrition and health claims made on foods (Annex).accessed .